Recently I read a post by Bob Lochel (low-shell). His stuff is great and he is one of the desmasters I’d turn to with any burning questions or wonderings. He brings to light some simple ideas that have been playing in my head recently. Let’s ask the bigger question:
What do these even look like?
I feel like I’ve often looked at all of these relationships as completely different, nearly unrelated. The bigger picture gives us two expressions, each on the side of a comparison symbol I remember from undergrad referred to as the trichotomy. Each of these expressions can be input into @desmos, and then the greater, equal, lesser relationship can be visualized. I’ve put together a handful here:
I don’t want to shy away from the algebraic process in articulating where these relationships are precisely defined. I’m just a fan of see what you’re doing. I’ve come to understand that students Believe it when they See it, and Own it when they Control it. Supporting an answer with visual information only strengthens the understanding. Desmos and Geogebra have make this possible.
The big idea: similar triangles have proportional measures.
Scene Change
And then we see this:
Segment Measures in Circles
And formulas like these:
Circle Segment Theorem 1Circle Segment Theorems 2 and 3
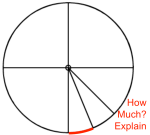
Wait, did you see that? Down at the bottom with the big red arrow. It’s fine print but it looks like a proportion of some sort.
Notice and Wonder
Max at MathForum shares the awesome of the notice and wonder practice in a math classroom. This is what I was experiencing when I saw (a)(b)=(c)(d) and some occasional references to a proportional measure of . I was noticing the proportions and wondering about similar triangles, dilation and those proportional relationships.
So This was my first date with Geogebra. I was hooked, and I never looked back. Geogebra allowed me to visualize my intuition and confirm my conjecture. Eventually I came up with an applet.
It wasn’t enough to just show how flipping a triangle could reveal the proportional relationship with similar triangles. We need to also build those proportions using actual measures. I made it so that the user could drag text boxes that correlated to the needed measures from the circle.
Where’s the similarity?
But wait, are all the relationships the same then? Not exactly. I would guess that this is also why most texts/reference guides give 3 separate theorems. What each instance does have in common is there are two triangles, one similar to the other. We just need to find the reflection that reveals the proportional relationships.
Lo-Tech
I can imagine others thinking right now, “That’s cool and all, but I don’t have tech for each of my students,” or “I’m not really a techie person.”
So use paper. (Patty paper works great). Or transparent stuff like sheet protectors.
Paper Practice
Let’s be real. This is great for conceptual understanding and visualizing the underlying relationships, but we need to practice. And practice often works hand in hand with paper. So we work with this concept for a half, maybe 3/4 of a period in the applets and then we practice fluency. I actually go back to something like the Kutasoftware sheet from the beginning. The difference this time is that we color code the segments, redraw them as embedded similar triangles, and use proportions.
And not once did we need those similar, yet not so similar theorems for circle segments.
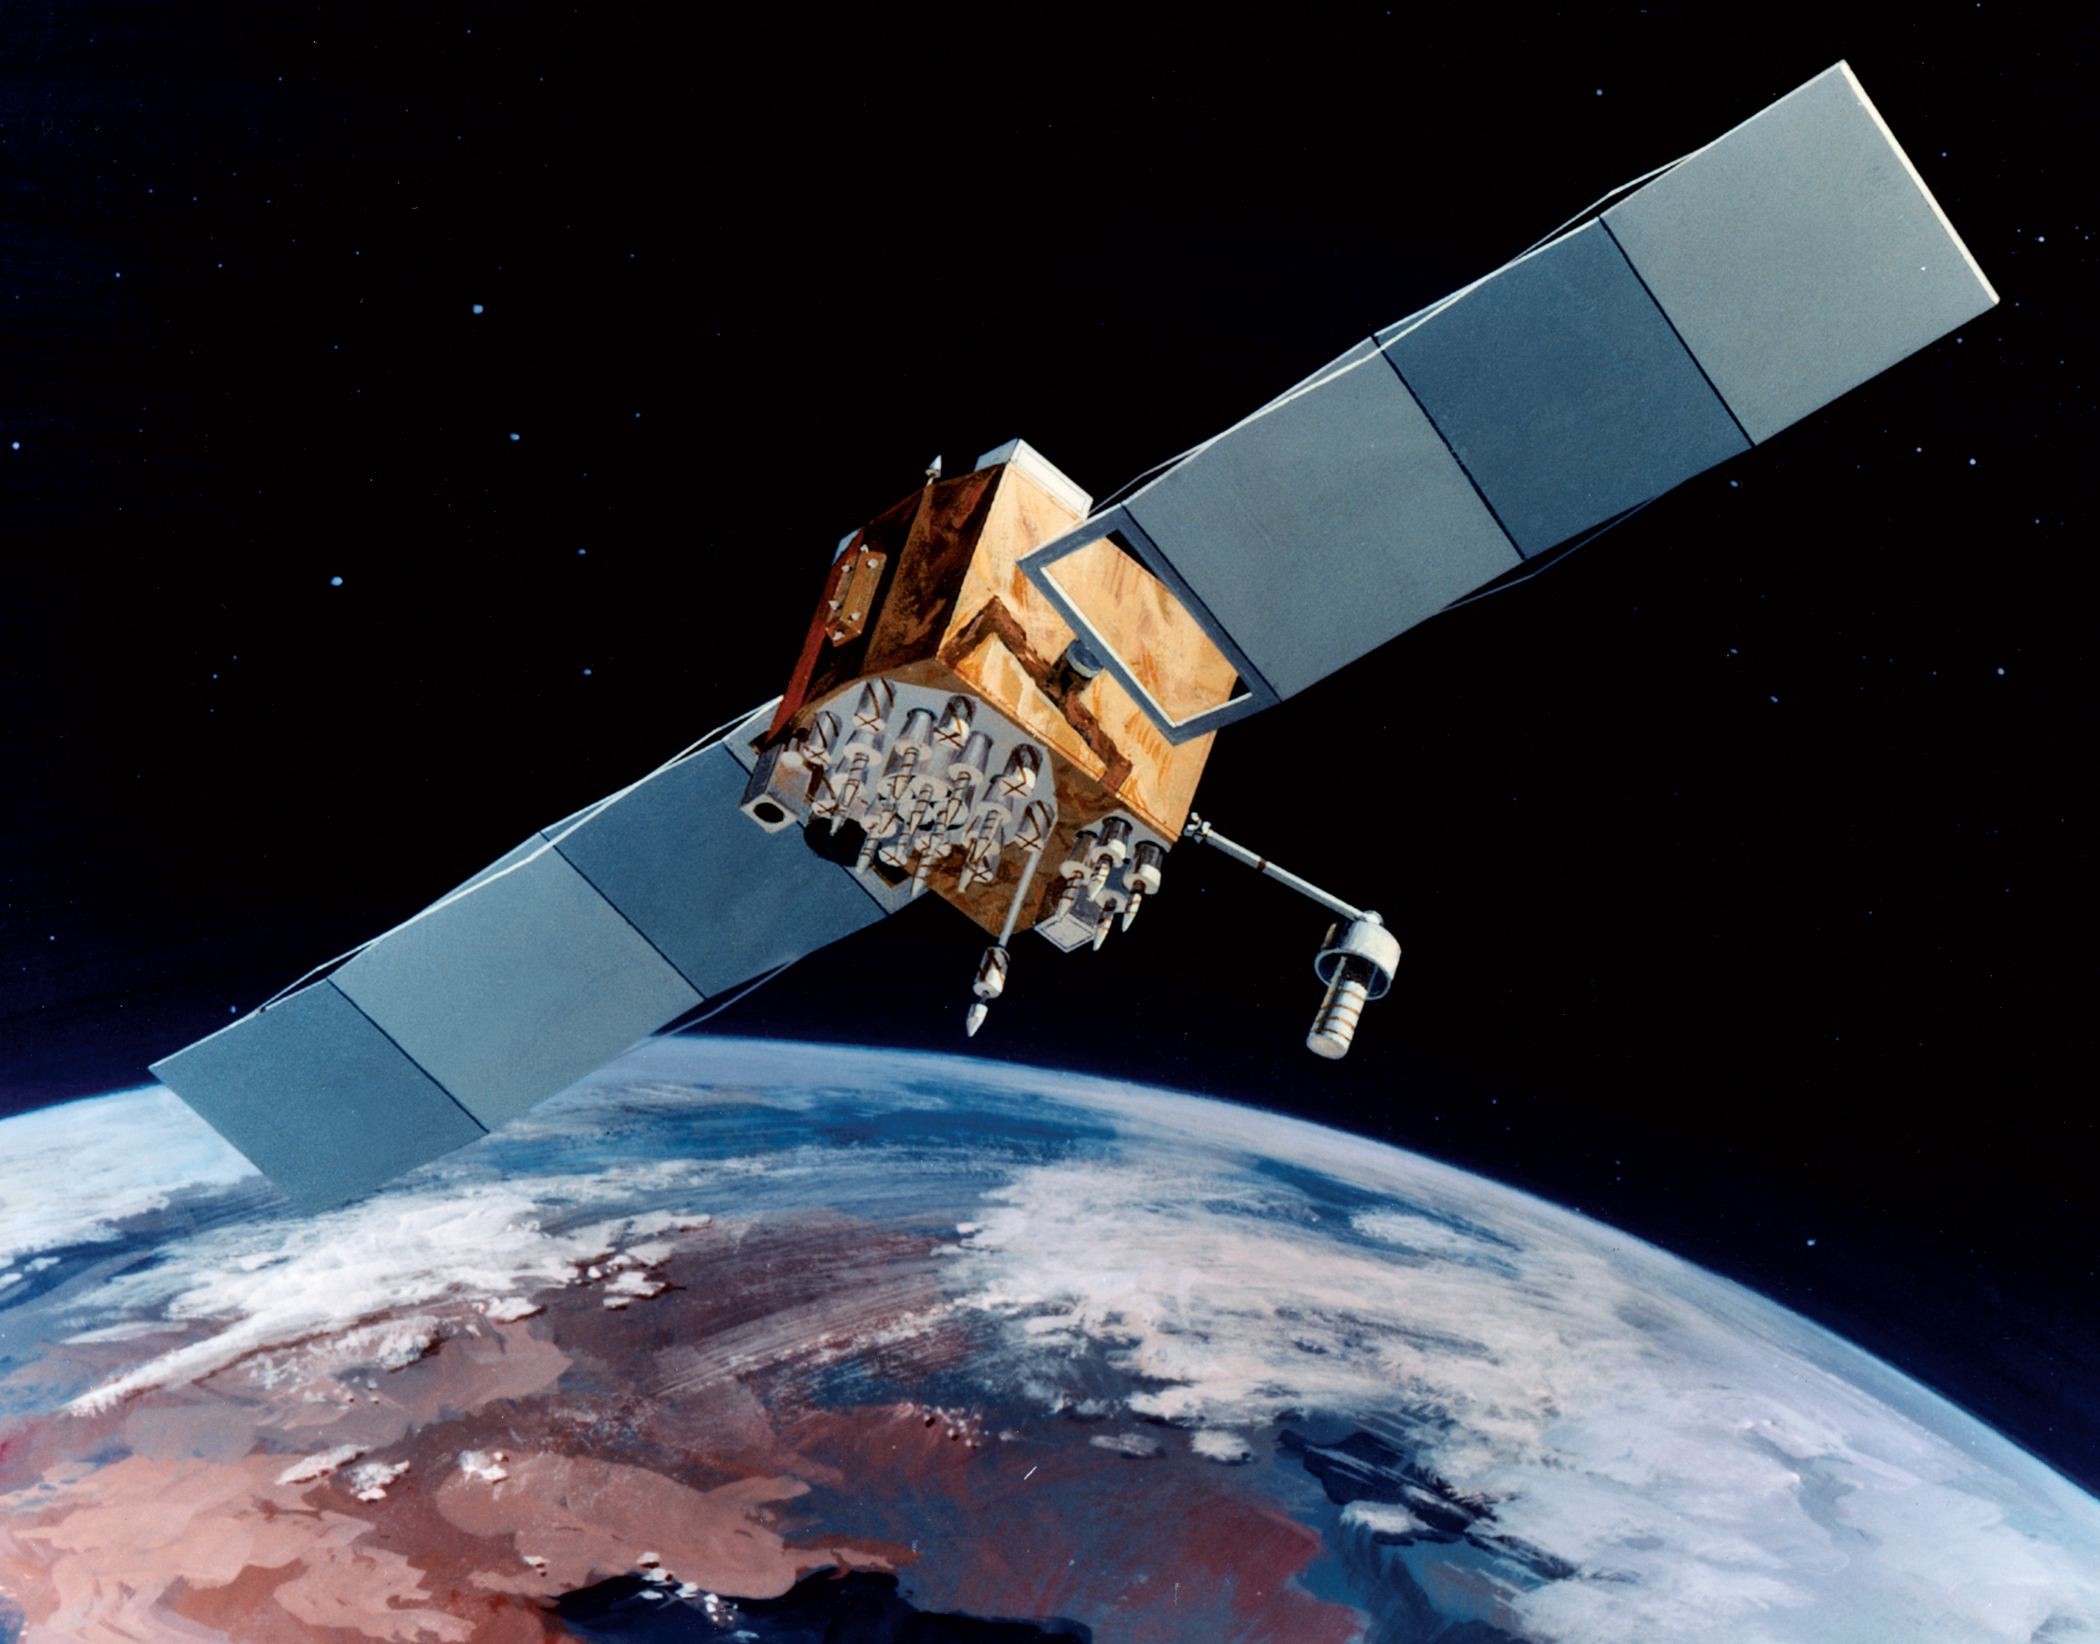
Have you ever wondered how far a satellite is from the planet? Sometimes people think about these objects flying through the sky and rotating around a planet. Such wonders have even inspired greats like Isaac Newton and Kepler.
Some good folk over at illustrative mathematics put this whole satellite into some simpler geometry with circles, triangles, and tangents.
What is the total area of the triangle (circle included)?
Then get all geeky advanced.
How do you calculate the value for the area of the blue shaded area (circle excluded)?
Student discourse:
Along the way here were some awesome teachable moments:
T: What kind of segments do you see? S1: Tangents
T: How do you know? S1: ’cause it says ‘tangent’.
T: I’m still not convinced. Maybe I mislabeled it. Prove it. S2: They’re perpendicular. Tangents are perpendicular.
T: Anything else? Any other types of segments or is that it? [crickets]
T: What about inside? Any segments inside the circle? S3: Radius! There’s a radius!
T: Where? S3: Here?
T: Where? Pretend I’m blind. S3: You already are blind Butler, that’s why you wear glasses.
T: [fake smile] S3: Here at AJ. Ohh, and also AF. And these ones to but you didn’t label them.
T: Do you notice anything else? What if you drag around that red thing? S3: They’re all the same?
T: What are the same? S3: The radiussus. Does that mean they’re equal?
T: What do you think? S3: Yeah, equal. They have to be, cause of the red thing.
S: Hey Butler, is that a kite?
T: It sure looks like it huh? What do we know about kites? S: There’s stuff that’s the same. Like congruent.
T: For example…? S: The pieces that match.
T: So how can you use that? S: They’re equal. Oh wait, they’re equal. Sooo….
And then the student goes on to apply that understanding to fill in the blanks for the missing segment lengths.
The idea of using a few measures, congruent relationships, and some triangle calculations helped the students apply the geometry and calculations further than just one calculation. As a follow up assessment they completed a static version of the question. This was easy to create by just taking a screenshot of the applet at some particular balance.
Some day I want to advance this further with some clock math.
Once similarity intuition has been built with circles, we can start getting into more specific relationships with angles and segments. This post will look at using visual information from central angles and inscribed angles.
Students sometimes lack intuition for the measure of something. Andrew Stadel has developed this idea into a thorough curriculum on estimation. In my classes we started reasoning through similar exercises. Once we had a decent understanding of circle parts and whole, we moved on to other types of angles.
Non-Central Angles
At this point most students have the common sense that a circle has 360 degrees, and a triangle is half that at 180 degrees. Built with this intuition in mind, we look at a triangle created by inscribed angles.
The next day we get to see the formula that collapses 3 ideas down to 1.
Dynamic Angles in Circles
So many of us have tried to organize all the formulas that go with circles. It’s nice when textbooks or other curriculum organizers dom something like:
This is nice, but it still implies that all these relationships are discrete. Instead it would be better to look at them as connected.
I originally thought students would look at this and see how the measures relate. It wasn’t obvious, so I interjected with a simple exercise to the students.
Congruent Overlap
I saw two half sheets (8.25×5.5) of paper on my desk. I held them up and asked the class, “Are these congruent?” The response was something like, “Uh, Duh Mr. Butler.” So I challenged them further, “Would you bet $1,000 on it?”
Now the silent sound of a gambler’s contemplation…
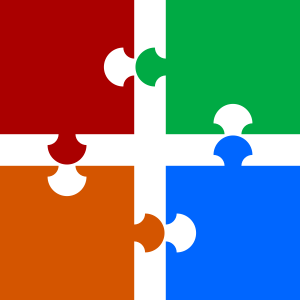
A more valuable decision requires some precision and accuracy. As they were thinking I allowed additional information, “You can’t touch them, but you can ask me to do anything you want.” They took the bait. “Just overlap them, Butler.” Now they’re headed in the right direction. Overlapping layers can reveal congruence or equal measure. Anyone could ask a similar question for an image like these puzzle pieces:
Congruent Puzzle Pieces
To support the visual information, students need to look at the measures involved and start building the relationships (SMP7 and SMP8). After multiple true versions of the math relationships, we can return to something like the original table.
Students start to see that the table is simply 3 snapshots of this dynamic relationship. Then it is easier to organize the information in their relative schemas. From here we go to paper practice with simple examples and eventually into a more complex question with multiple parts.
I took a discrete snapshot from this applet and used it as a paper assessment. Students were solving for complex relationships with multiple layers, and not all with the same process. Common Core math like this requires utilizing big picture relationships while at the same time being able to articulate the specifics within those relationships.
Next time:
This series of dynamic relationships within a circle continues next looking at segments, first with only tangents, and then into various combinations with secants and/or tangents.
Okay, maybe it’s not given. In fact, it needs to be proven. This proof is yet another that is so easily demonstrated with dynamic math tools (like desmos and geogebra
So long as you can move one center onto the other (translate) and dilate one radius to equal the other, similarity is achieved. This works for every circle. The perfect proportional balance achieved with circles lays the foundation for most of not all relationships found in them.
Proportional Measures
Similarity gives us a simple system for comparing measures in multiple figures.
You can even explore this with repetition of congruent triangles:
This activity was first inspired by a posting on John Stevens‘ website wyrmath.wordpress.com . It looks at proportions with a different angle (pun intended) and asks user to compare various portions of different sized (but similarly shaped) pizza.