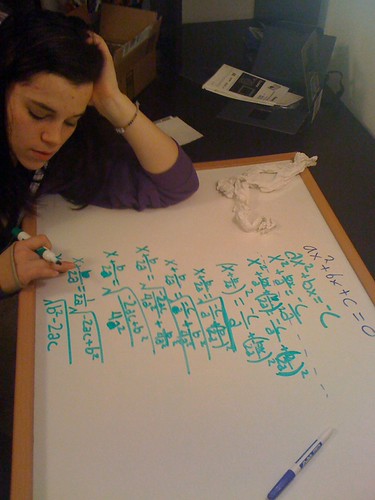
courtesy of Samuel Winter via flickr CC-BY-NC-SA License
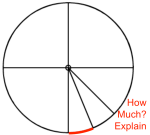
How would you graph? ![]()
Would you factor? Would you complete the square? Quadratic Formula? Are those my only options?
The idea of multiple representations of the same thing, or multiple methods toward the same end, has strong correlation for learning (and teaching) mathematics. Jo Boaler demonstrates this in her number talks. Dan Meyer and Robert Kaplinksy discuss these through the open middle problem design. One way we see this in polynomials (including quadratics) is…
Factoring
There’s the famous XBox method, often abbreviated to a formulaic method by teachers. I like this approach, especially because it incorporates area models, grouping, flexibility for multiple values of the lead coefficient “a”. James Key (aka @iheartgeo), brings in more of the number talk by using powers of 10 in addition to powers of x
.
Here’s a quick preview of his vine that relates:

Transitioning to more algebraic/abstract examples seems simpler when relating quadratics to numerical examples like this vine. He looks at the factors and the relationships between the terms. Students in his class are prescribed a formula, but asked to make sense of the relationships and then transition to methods with more regularity.
Complete the Square
A method often confusing to Algebra 1 students because of its abstract structure is again made simple with looping short videos.

Plenty of teachers try to support their process with visualization, all that is intended here is to start with the visual reasoning and pattern making, then move to abstract.
The hybrid
It’s not exactly completing the square. It’s not exactly factoring and using the roots. It’s the compromise between the two.
- plot the points (0,0) and (-b,0)
- shift vertical c units.
Let’s make that easier. Here’s a dynamic version:

Open up the Middle
But wait, the two points (x1,0) and (x2,0) that plot on the horizontal axis can be any combination that adds up to your linear coefficient “b”. The vertical shift just needs to balance those numbers with c.
So for our example: ![]() , the 8x needs to be split, and c needs to be balanced with the shift:
, the 8x needs to be split, and c needs to be balanced with the shift:
| x1 | x2 | c | shift? |
| 8 | 0 | 20 | 20 |
| 0 | 8 | 20 | 20 |
| 4 | 4 | 20 | 4 |
| 2 | 6 | 20 | 8 |
| 1 | 7 | 20 | ? |
| -2 | 10 | 20 | ? |
| 3 | 5 | 20 | ? |
Now with that bit of intuition, we can open up the middle and have the user do some exploration. Here’s a question that encourages looking at multiple representations and seeing how the values are connected:

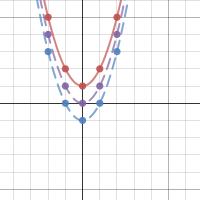
When thinking of factors, roots, and vertical shifts, the relationship becomes more dynamic. We could revisit the open middle prompt and ask to define / express the relationship between a,b and c. Struggling students can simplify the algebra using Jame’s Keys approach with substituting a value for x. Here’s a Geogebra applet to help visualize the multiple representations:
Play with the applet and notice that as long as the quadratics share the same line of symmetry, only a vertical shift is needed to overlap. This also reveals the congruence in some quadratics. Ask yourself what makes the quadratics congruent?
Here’s a similar interactive graph built with Desmos.
What now?
I would expect that this more flexible visualization allows for more depth in understanding how a quadratic function works, both visually and algebraically. Students who are asked to match quadratic algebraic expressions may be little less intimidated by starting with some dynamic pictures. So now let’s return to the original question (that has multiple possibilities):
How would you graph? ![]()
What other questions might you ask?