So this happens in geometry:
It relates back to dilations.
The big idea: similar triangles have proportional measures.
Scene Change
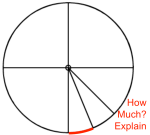
And then we see this:
And formulas like these:
Wait, did you see that? Down at the bottom with the big red arrow. It’s fine print but it looks like a proportion of some sort.
Notice and Wonder
Max at MathForum shares the awesome of the notice and wonder practice in a math classroom. This is what I was experiencing when I saw (a)(b)=(c)(d) and some occasional references to a proportional measure of . I was noticing the proportions and wondering about similar triangles, dilation and those proportional relationships.
So This was my first date with Geogebra. I was hooked, and I never looked back. Geogebra allowed me to visualize my intuition and confirm my conjecture. Eventually I came up with an applet.
Applets
It wasn’t enough to just show how flipping a triangle could reveal the proportional relationship with similar triangles. We need to also build those proportions using actual measures. I made it so that the user could drag text boxes that correlated to the needed measures from the circle.
Where’s the similarity?
But wait, are all the relationships the same then? Not exactly. I would guess that this is also why most texts/reference guides give 3 separate theorems. What each instance does have in common is there are two triangles, one similar to the other. We just need to find the reflection that reveals the proportional relationships.
Lo-Tech
I can imagine others thinking right now, “That’s cool and all, but I don’t have tech for each of my students,” or “I’m not really a techie person.”
So use paper. (Patty paper works great). Or transparent stuff like sheet protectors.

Paper Practice
Let’s be real. This is great for conceptual understanding and visualizing the underlying relationships, but we need to practice. And practice often works hand in hand with paper. So we work with this concept for a half, maybe 3/4 of a period in the applets and then we practice fluency. I actually go back to something like the Kutasoftware sheet from the beginning. The difference this time is that we color code the segments, redraw them as embedded similar triangles, and use proportions.
And not once did we need those similar, yet not so similar theorems for circle segments.